

ICMA European repo market survey June 2023
Summary

Key points
· The survey hit a record outstanding value of EUR 10,794 billion (+11.5% YOY) but growth decelerated over H1 2023.
· The survey sample cut back its long-standing net reverse repo position by reducing gross securities borrowing/cash lending.
· Floating-rate repo continued to gain share (to 14.9%), with growth largely outside the traditional floating-rate market in France.
· Tri-party rallied on the back of the general recovery in GC repo and further growth in GC financing.
· The share of voice-brokers also rallied.
· ATS and CCP-clearing continued to grow but outside the survey sample, meaning that they lost share in the survey.
· The share of govies in the pool of European collateral fell as the use of non-government securities increased at a faster rate, in particular, covered bonds.
· The share of French govies overtook that of German govies.
· The unwinding of ECB support forced peripheral eurozone banks back into the repo market, resulting in an increase in Italian and Spanish collateral.
· The share of sterling repo contracted, possibly reflecting a shrinking short base.
· There was the usual seasonal contraction in term-to-maturity and forwards fell back (to 18.3%).
· The survey sample ran an even more negative funding gap.
Summary of results
The June 2023 survey report is out on the streets at last. The full report is on the ICMA website.
The headline is that the survey hit a new record of EUR 10,794 billion (+11.5% YOY), continuing the uptrend that started in 2016 on the back of the ECB’s Enhanced Asset Purchase Programme and the market’s assimilation of new Basel regulations on capital, leverage and liquidity.[1]
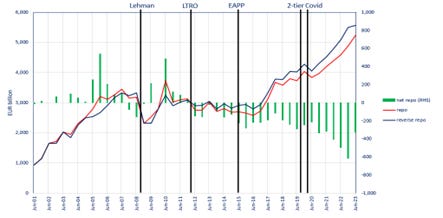
Chart 1: total size of ICMA European repo market survey (repo plus reverse repo)

Given that the ICMA survey is of a sample of European repo participants, EUR 10,794 billion must be taken as a floor to the actual size of the market. That number is supposedly given by SFTR public data. The combined EU-27 plus UK SFTR number (on the reporting date of 16 June) was EUR 21,698 billion. The ICMA survey is therefore 50% of the SFTR number.
Chart 2: ICMA survey v SFTR public data

While the market (as proxied by the survey) continued to grow over H1 2023, there was a further deceleration in the rate of growth (to +4.1% from +7.2% over H2 2022 and +10.9% over H1 2022). Is the inflow of new cash and participants that was triggered by higher rates and steepening yield curves running out of steam?
As central banks have withdrawn liquidity and sold collateral back to the market, there has been a shift in activity to cash-driven GC repo from the securities-driven repo against specific collateral that has prevailed since QE started in 2015. This can be seen in the swing in the net position of the survey sample. Since 2012 (the start of regular long-term liquidity support by central banks), the survey sample has been running a net reverse repo position (see Chart 3), that is, a net lender of cash and net borrower of (scarce) securities. This position was boosted by QE in 2015 and by Covid support in 2020. It peaked at about 6% of the survey size in December. But, in the latest survey, the net position fell back sharply due to a deceleration in the growth of gross cash lending and securities borrowing.
Chart 3: repo, reverse repo and net position of the survey sample
Repo rate analysis
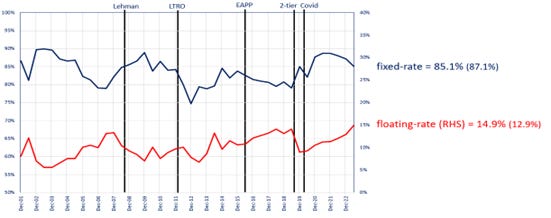
One of the least unexpected results of the June survey was the continued growth in floating-rate repo. This used to be the preserve of the French market with its large community of SICAV monétaires. Recent growth, however, has been more widespread. Adoption has reportedly been facilitated by dealers upgrading their booking systems to manage floating rates. It has also been suggested that floating-rate repo is the preferred defensive strategy of young dealers with no experience of rising interest rates. Further growth may be encouraged by the roll-out of spread trading by trading platforms and LCH.
Chart 4: fixed versus floating repo rates
Trading analysis
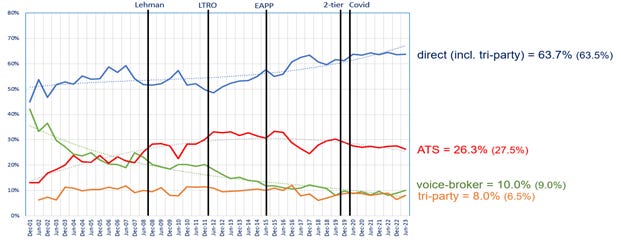
A significant development in the survey results was the recovery of tri-party repo. This cash-driven repo has long been suppressed by QE and its expected recovery last year was derailed when cash investors were spooked by interest rate uncertainty. In June, however, its share jumped to 9.0% from 6.5%.
One element in the recovery of tri-party repo was the continued growth of GC financing (which combines tri-party collateral management with CCP-clearing). The attraction of GC financing has been that it is a source of term repo. Most of this term activity has been on Eurex’s GC Pooling platform, which seems to have recruited buyside and official institiutions who are natural term players.
The other growth story in the survey was voice-brokers. Their share has been in secular decline over the whole history of the survey, with automatic trading systems (ATS) eating more and more of their lunch. But they just won’t lie down and die. The latest survey saw their share rise to 10% from 9%. One reason was an increase in the number of banks employing voice-brokers. This may have been happened during the SVB and Credit Suisse episodes in March. Voice-brokers typically gain in market stress, as they offer the variable-cost option of being able to immediately expand a dealer’s search for liquidity whenever the market starts to dry up. Perhaps some dealers have thought it prudent to retain the services of voice-brokers? Another reason that has been suggested for the growth of voice-broking is that they have been busy arranging term OTC trades that are then passed to Eurex Clearing using Eurex Repo and GC Pooling as a portal.
The turnover and outstanding value reported by ATS expanded over H2 2023 but the ATS platforms’ aggregate share of automatic electronic trading in the survey continued to drift down, suggesting that much of their growth was outside the survey sample.
Chart 5: execution venues
Geographical analysis
The revival of GC Pooling and Eurex Repo may help explain some of the recent growth in cross-border business between counterparties within the eurozone (as opposed to cross-border business into and out of the eurozone) --- see Chart 6 --- as these platforms, particularly GC Pooling, are almost closed ecosystems within the eurozone (eg in 2022, 71% of GC Pooling users did 90-100% of their repo business on GC Pooling). Intra-eurozone repo would also seem to be the area where voice-brokers have been expanding their business.
Like ATS, anonymous trading --- in other words, CCP-cleared repo --- continued to grow but mainly outside the survey sample, meaning that it lost share in the survey (to 16.2% from 17.3%). On the other hand, post-trade registration of OTC repo recovered to 8.4% from 5.7%. Some of the post-trade registration through Eurex Repo and GC Pooling (including some voice-brokered trades) may be reflected here, although others may have been reported as ATS trades.
Chart 6: geographical flow

Currency analysis
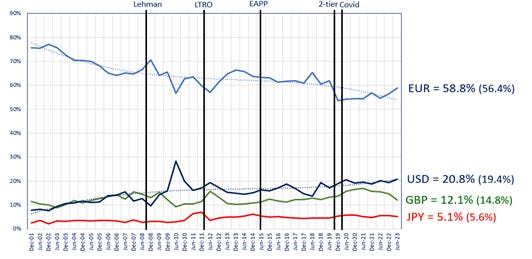
The share of the euro continued to rise, largely as a counterpart to the reduced share of sterling. The share of the dollar continued to trend upwards but yen was going nowhere, reflecting a calm cross-currency basis.
Chart 7: cash currencies
Collateral analysis
Despite a significant increase in the value of government securities, their share fell from 91.0% to 90.2% of European collateral due to the even faster rate of growth of non-government securities. In particular, the share of covered bonds surged (to 20% of tri-party repo alone), reflecting the unwinding of TLTRO, where these assets had previously been financed. There also substantial increases in the value of supranationals and corporate bonds in tri-party repo.
Chart 8: share of government securities in European collateral pool

Sterling repo diminished (to 12.1%), possibly reflecting a shrinking short base.
Chart 9: shares of securities by county of issuance
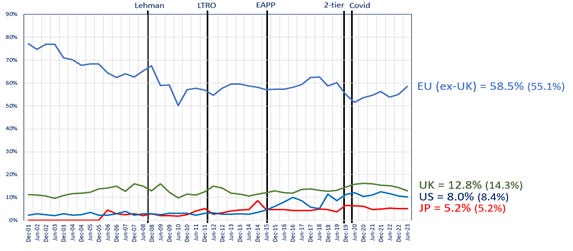
Shares of core and periphery eurozone securities
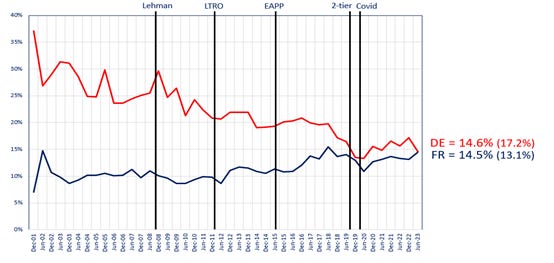
German collateral (14.5%) lost ground to French collateral (14.5%). Use of German government securities (13.4%) may have been dampened by reduced demand for safe assets in the current benign market conditions. The share of French government securities (13.8%) may have benefited from the buyside building HQLA buffers.
Chart 10: shares of core eurozone securities
The unwinding of ECB support forced peripheral eurozone banks back into the repo market resulting in an increase in Italian and Spanish collateral (to 13.7% and 6.1%, respectively).
Chart 11: shares of periphery eurozone securities

Maturity analysis
There was the usual mid-year rebound in short-dates but much more vigorous than in previous years. But there was a sharp retreat in the 3 to 6-month band, where collateral transformation is most evident.
Chart 12: maturity analysis

The survey sample continued to run a negative funding gap but gross borrowing became shorter-term.
Next survey
Wednesday, 13 December.
[1] Note that the survey measures the outstanding value (not turnover) of the repo and reverse repo on the books of 62 participants at close of business on 14 June 2023 It is not adjusted for double-counting and it excludes monetary policy repos with central banks.